
Tracking Signal (TS): Fine-Tuning Forecast Performance
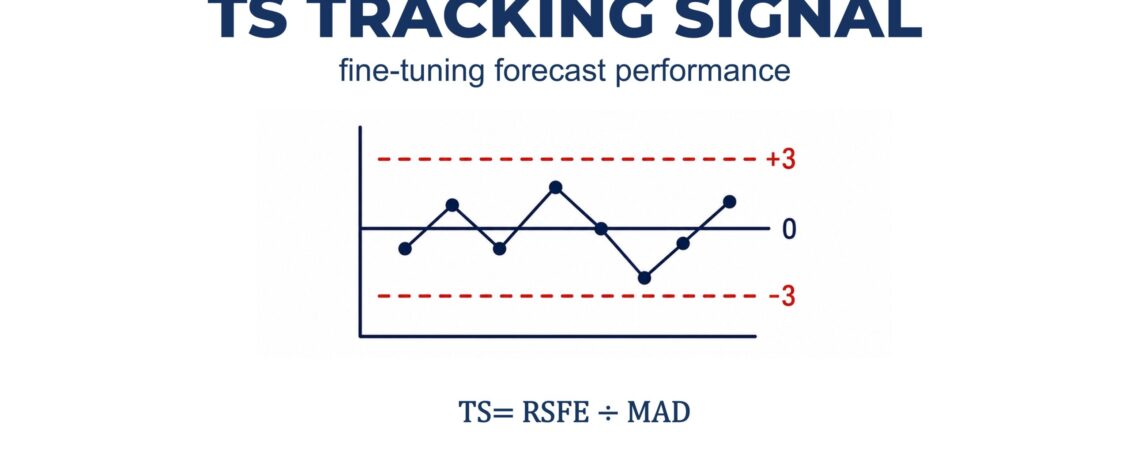

Imagine an operation where Forecast Accuracy remains high. MAPE stays within the target range. Forecast Bias also appears acceptable. Yet, month after month, inventory continues to grow or recurring product shortages begin to appear. The explanation may lie in a metric that often receives little attention: the Tracking Signal (TS).
The Tracking Signal identifies when forecast errors stop representing natural variation and begin to reveal a recurring pattern. Its purpose is to detect the emergence of forecast bias before it causes significant impacts on planning.
🤝 Sponsored Post: https://www.achain.com.br/
What is the Tracking Signal?
The Tracking Signal measures the relationship between the cumulative forecast error (RSFE) and the Mean Absolute Deviation (MAD). Its purpose is to determine whether the forecasting process is developing a persistent tendency to overestimate or underestimate demand.
While metrics such as MAPE, MAD, and Forecast Accuracy measure the magnitude of forecast errors, the Tracking Signal answers a different question: Are forecast errors still randomly distributed over time, or are they consistently occurring in the same direction?
For this reason, the Tracking Signal acts as a fine adjustment to forecast quality. While other metrics indicate how much the forecast missed the actual demand, the TS reveals whether the forecasting process remains under statistical control or has begun to develop a recurring bias that requires corrective action.
Operational impact
When the Tracking Signal remains outside the control limits, the entire operation may begin to experience negative consequences, even if other forecasting metrics appear satisfactory.
These consequences include frequent production plan revisions, purchasing incorrect quantities, excess inventory, material shortages, and a gradual loss of confidence in the forecasts used across different business functions.
Metric calculation
The Tracking Signal is calculated using the following equation:
TS = RSFE ÷ MAD
Where:
- RSFE = Running Sum of Forecast Errors.
- MAD = Mean Absolute Deviation.
Example
Consider the following data:
Record: Period = 1; Demand = 95; Forecast = 100; Error = -5.00
Record: Period = 2; Demand = 210; Forecast = 200; Error = 10.00
Record: Period = 3; Demand = 145; Forecast = 150; Error = -5.00
Record: Period = 4; Demand = 82; Forecast = 80; Error = 2.00
Absolute errors: 5, 10, 5, and 2
MAD = (5 + 10 + 5 + 2) ÷ 4 = 5.5
RSFE = (-5 + 10 – 5 + 2) = 2
TS = 2 ÷ 5.5 = 0.36
In this example, the Tracking Signal equals 0.36. Although there is a small cumulative forecast error, the indicator remains close to zero and within the control limits, indicating that the forecasting process is still under statistical control.
How to interpret the Tracking Signal
Unlike Forecast Accuracy, which measures forecast performance, the Tracking Signal evaluates the stability of the forecasting process over time. Therefore, it should be interpreted using a control chart, where the TS values are plotted and monitored period after period.
Under normal conditions, the Tracking Signal is expected to fluctuate between the control limits of +3 and -3. As long as it remains within this range, cumulative forecast errors can be considered natural process variation, with no evidence of systematic forecast bias.
When the Tracking Signal exceeds +3 or -3, or begins to display patterns that indicate a loss of statistical control, it provides strong evidence that the forecasting process has developed a recurring bias. In this situation, the underlying causes should be investigated before the problem results in excess inventory, stockouts, incorrect purchasing decisions, or frequent changes to the production schedule.
A high Forecast Accuracy does not necessarily mean that the forecasting process is healthy. It is entirely possible to achieve excellent forecast accuracy while the Tracking Signal falls outside the control limits. This occurs when individual forecast errors are relatively small but consistently occur in the same direction. While Forecast Accuracy measures the level of forecast correctness, the Tracking Signal detects recurring trends that may go unnoticed by other forecasting metrics.
In practice, record the Tracking Signal value for every planning cycle and monitor its evolution using a control chart. The interpretation should follow the same principles used in Statistical Process Control (SPC), evaluating not only points outside the control limits but also trends, recurring sequences, and other patterns that indicate a loss of process stability. This approach makes it possible to identify forecast bias at an early stage and take corrective action before it affects supply chain performance.
What drives the indicator upward?
Several factors can cause the Tracking Signal to reach high values.
- Structural demand changes without updating the forecasting model.
- Outdated forecasting parameters.
- Frequent manual forecast overrides.
- Promotions and special events managed without a consistent methodology.
- Inconsistent or poor-quality data.
- Market changes ignored during forecast reviews.
- Lack of continuous monitoring of cumulative forecast errors.
Recommended actions
- Monitor the Tracking Signal during every planning cycle.
- Use a control chart with limits set at +3 and -3.
- Investigate persistent deviations immediately.
- Review forecasting models whenever the indicator remains outside the control limits.
- Analyze the Tracking Signal together with Forecast Accuracy, Forecast Bias, MAPE, and MAD.
- Document identified root causes and corrective actions.
- Periodically validate the forecasting parameters.
Key takeaways
- Small forecast errors can hide a recurring problem.
- The Tracking Signal identifies trends that other metrics may overlook.
- A control chart allows the early detection of forecast bias.
- High Forecast Accuracy does not eliminate the need to monitor the Tracking Signal.
- Historical monitoring helps identify persistent deviations.
- Forecasting metrics should always be interpreted together.
- The Tracking Signal provides a fine adjustment for evaluating the quality of the forecasting process.
What about your operation?
Does your company monitor the Tracking Signal using a control chart with limits of +3 and -3, or does it rely only on traditional forecast error metrics?
Have you ever encountered a situation where Forecast Accuracy appeared excellent, but the Tracking Signal revealed a recurring bias that required changes to the forecasting model?
📚 Ebooks: https://www.cesarmangabeira.com.br/