
FVA Forecast Value Added: interpretation and calculation

FVA Forecast Value Added: interpretation and calculation
You adjusted the forecast, gathered contributions from different areas, and reached consensus. After the actual period, an important question arises: how much did each intervention really improve the forecast?
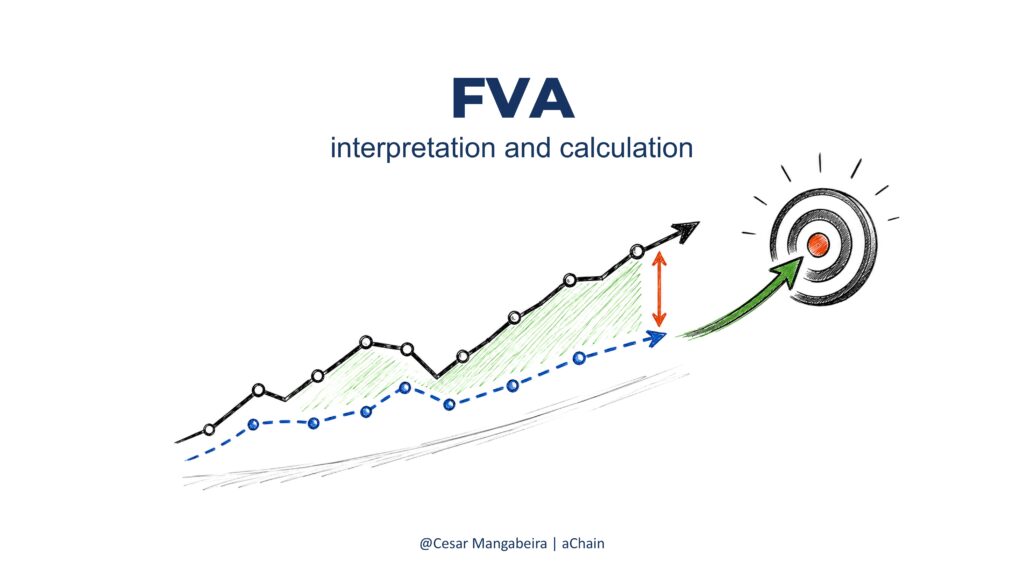
FVA helps answer this question by comparing each stage of the forecast with a forecast baseline.
🤝 Sponsored Post: www.achain.com.br
What it is
FVA (Forecast Value Added) measures how much an intervention contributed to improving or worsening a reference forecast, called the forecast baseline.
In most applications, the statistical forecast is used as the baseline.
Impact on day-to-day operations
The indicator helps identify effects that can go unnoticed during the forecasting process:
- Evaluates the reliability of forecast interventions.
- Shows which contributions brought the forecast closer to actual demand.
- Helps understand the predictability achieved at each stage.
- Reduces discussions based only on perception.
- Supports decisions about interventions that add value.
- Highlights rework that produces little result.
- Allows the evolution of collaborative forecasting to be monitored.
Indicator calculation
FVA can use different performance metrics. In this article, the calculation uses Forecast Accuracy (FA).
The formula is:
FVA = FA of adjusted forecast − FA of forecast baseline
Where:
FA = Forecast Accuracy of the forecast being evaluated
FVA can also use error metrics such as MAPE, WMAPE, MAD, and RMSE.
When an error metric is used:
FVA = Error of forecast baseline − Error of adjusted forecast
The interpretation depends on the metric selected.
With Forecast Accuracy:
- Positive FVA = gain relative to the baseline.
- FVA equal to zero = performance equal to the baseline.
- Negative FVA = reduction in performance relative to the baseline.
Numerical example:
Adjusted FA = 97%
Baseline FA = 91%
FVA = 97% − 91% = +6 percentage points
The result indicates a gain of 6 percentage points over the forecast baseline.
Application
Consider a forecast of 100 units and actual demand of 110 units.
Statistical Forecast; Forecast = 100; Actual Demand = 110; Forecast Accuracy = 91%
Planning Collaboration; Forecast = 107; Actual Demand = 110; Forecast Accuracy = 97%
Commercial Collaboration; Forecast = 112; Actual Demand = 110; Forecast Accuracy = 98%
Marketing Collaboration; Forecast = 109; Actual Demand = 110; Forecast Accuracy = 99%
Consensus; Forecast = 108; Actual Demand = 110; Forecast Accuracy = 98%
The statistical forecast has an FA of 91% and will be used as the forecast baseline.
FVA Planning = 97% − 91% = +6 percentage points
FVA Commercial = 98% − 91% = +7 percentage points
FVA Marketing = 99% − 91% = +8 percentage points
FVA Consensus = 98% − 91% = +7 percentage points
Marketing shows the largest individual gain, with 8 percentage points over the baseline.
The consensus forecast shows a gain of 7 percentage points compared with the statistical forecast.
What drives the indicator down
- Adjustments made based only on perception.
- Changes made without historical analysis.
- Interventions without defined criteria.
- Lack of performance monitoring.
- Comparisons made using different baselines.
- Evaluation without considering actual demand.
- Continuing interventions that repeatedly produce negative FVA.
Recommended actions
- Define which forecast will be used as the baseline.
- Use the same actual demand to evaluate all forecasts.
- Record each intervention made during the process.
- Calculate FVA for each participating area.
- Track positive and negative results across periods.
- Investigate interventions with recurring negative FVA.
- Keep activities in the process when they demonstrate measurable contribution.
Lessons learned
- FVA measures the contribution of an intervention relative to the baseline.
- The statistical forecast usually represents the forecast baseline.
- All forecasts should use the same actual demand as the reference.
- Positive FVA indicates a gain relative to the baseline.
- Negative FVA indicates a reduction in performance compared with the initial forecast.
- The indicator makes it possible to identify which interventions add value to Collaborative Forecasting.
- Objective indicators help guide decisions about interventions in the forecasting process.
What about your operation?
Does your operation measure only the final forecast result, or does it also track how much each intervention contributes to the result?
Which indicator would you like to see in the next article?
🤝 Sponsored Post: www.achain.com.br
Comments and sharing
Which type of collaboration tends to generate the greatest gain over the statistical forecast?
Have you ever encountered a collaboration that increased the workload of the process and resulted in negative FVA?