Continuous, Trend, and Seasonal Demand: How to Choose the Demand Forecasting Model
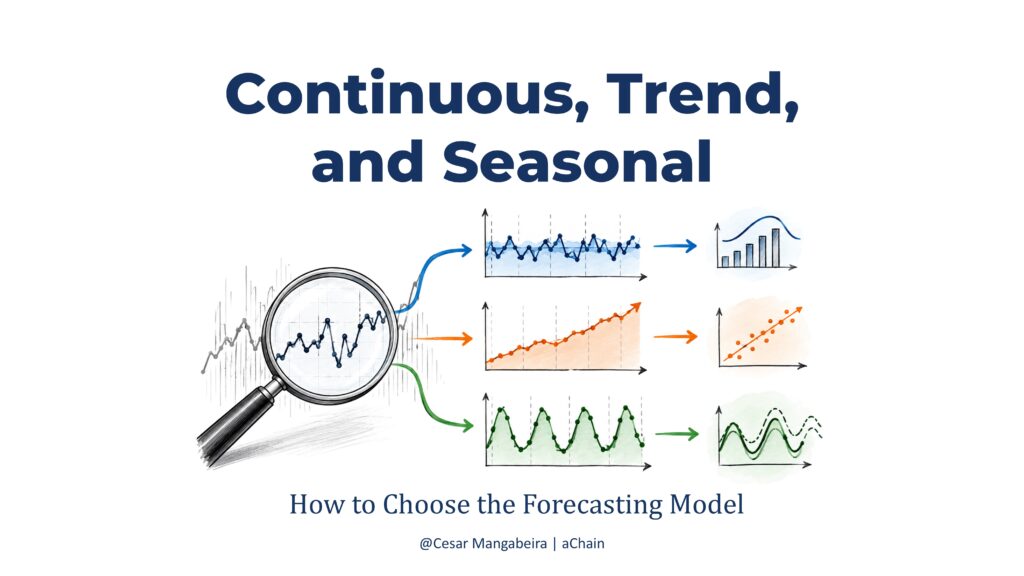

Demand can exhibit different behaviors over time. The same offering can show growth in a given context, stability during another period, or recurring fluctuations at certain moments.
The observed behavior results from the interaction between the product, company, market, life cycle, and business characteristics.
The classification is based on the historical demand series, considering the context in which the data was recorded.
🤝 Sponsored Post: www.achain.com.br
📚 eBooks list: www.cesarmangabeira.com.br. S&OP Maturity, Demand Management, Demand Meeting, Collaborative Forecasting, Procurement. Available through major digital bookstores. Published in Portuguese, English, and Spanish.
- Demand Depends on Context
Continuous, trend, and seasonal are classifications related to the behavior of the historical series.
A product can show growth for one company while remaining stable for another. The same company can observe growth during one phase of the life cycle and stability during another. Changes in the market or business model can also modify the trajectory.
Therefore, the product alone does not determine demand behavior.
The analysis considers:
- Product and offering characteristics.
• Company and market share.
• Life cycle.
• Market cycle.
• Business characteristics.
• Period analyzed.
- The Life Cycle Changes Behavior
Throughout a product’s trajectory, demand presents different patterns.
During introduction, fluctuations can occur while the offering gains market acceptance.
During growth, the series presents an upward trend.
At maturity, demand can present behavior close to a stable level.
During decline, a downward trend emerges.
Seasonality can appear at any stage of the life cycle.
Therefore, demand behavior needs to be analyzed according to the life cycle stage being considered.
- The Market Cycle Also Influences Demand
The market can be in expansion, maturity, or contraction.
One company can experience growth while the market expands. Another company operating in the same market can experience stability. A third company can experience decline due to changes in its market share.
Therefore, the same product can present different historical series depending on the company and market analyzed.
- The Business Modifies the Curve
Commercial decisions and operational changes alter demand behavior.
Distribution expansion, entry into new channels, price changes, promotional campaigns, portfolio changes, and variations in market share can modify the historical series.
The appropriate question for forecasting is:
“What behavior does demand exhibit in this context?”
This question directs the analysis toward the company’s historical series, considering the product, market, life cycle, and business characteristics.
- Most Commonly Used Forecasting Models
Some models are widely used in demand forecasting and can be applied to different behaviors of the historical series.
- Moving Average: calculates the forecast based on the average of previous observations, using equal or different weights for the periods considered.
- Regression: estimates the direction of the series and incorporates explanatory variables, allowing relationships between demand and factors influencing its behavior to be represented.
- Decomposition: separates the components of the series, allowing the analysis of level, trend, seasonality, and residual component.
These models can be applied to different demand behaviors. The selection considers the characteristics of the historical series, model performance when applied to the data, available tools, and the company’s knowledge base.
- Continuous Demand
Continuous demand presents regular occurrences over time, with fluctuations around a given level.
For this behavior, some models are particularly suitable:
- Simple Moving Average: calculates the forecast based on the average of the most recent demand observations.
- Weighted Moving Average: calculates the forecast by assigning different weights to observations, allowing greater influence for specific periods.
- Simple Exponential Smoothing (SES): calculates the forecast for the next period through a weighted average between the latest actual demand and the latest forecast, using the smoothing constant α.
Regression and Decomposition can also be used in the treatment of the series. Through seasonalization and reseasonalization, these methods allow seasonal effects to be removed from the historical series and incorporated back into the forecast, potentially improving forecast results in series with seasonal effects.
- Trend Demand
Trend demand presents growth or decline over a given period.
For this behavior, models that incorporate trend are particularly suitable.
- Holt’s Model: incorporates level and trend, allowing the projection of series with persistent growth or decline movements.
- Damped Trend: incorporates the trend and gradually reduces its influence as the forecast horizon advances. The model represents a trend that progressively loses strength in future projections.
Moving Average, Regression, and Decomposition can also be used in the analysis and forecasting of trend series, according to the characteristics of the historical series.
- Seasonal Demand
Seasonal demand presents fluctuations that repeat during specific periods.
For this behavior, models that incorporate seasonality are particularly suitable.
- Additive Holt-Winters: considers level, trend, and seasonality, with seasonal variations having approximately constant amplitude over time.
- Multiplicative Holt-Winters: considers level, trend, and seasonality, with seasonal variations proportional to the demand level. As the demand level increases, the amplitude of seasonal fluctuations increases proportionally.
Moving Average, Regression, and Decomposition can also be used in the analysis and forecasting of seasonal series, according to the characteristics of the series, available tools, and the company’s knowledge base.
A single series can present trend and seasonality simultaneously. It can also present periods of stability between growth or decline phases.
🤝 Sponsored Post: www.achain.com.br
📚 eBooks list: www.cesarmangabeira.com.br. S&OP Maturity, Demand Management, Demand Meeting, Collaborative Forecasting, Procurement. Available through major digital bookstores. Published in Portuguese, English, and Spanish.
- How to Choose the Forecasting Model
The objective of this article is to present the main demand behaviors and relate them to forecasting models. Model calculations are not part of this article.
In aChain courses, models are covered through complete calculations, application to historical series, analysis of results, comparison between methods, and interpretation of forecasting indicators.
Model selection starts with the behavior identified in the historical series.
Observe the series
Identify level, trend, seasonality, fluctuations, and changes in behavior.
Analyze the context
Consider life cycle, market cycle, company market share, and business characteristics.
Evaluate compatible models
Select models capable of representing the components found in the series.
Compare the results
Indicators such as MAPE, MAD, Forecast Accuracy (FA), Bias, and Tracking Signal (TS) support the evaluation of results.
Review when behavior changes
A change in the series pattern requires reassessment of the model used.
Conclusion
Continuous, trend, and seasonal represent behaviors identified in the historical demand series, rather than permanent characteristics of a product.
Demand analysis needs to consider the context in which data was recorded, including life cycle, market cycle, company market share, and business characteristics.
The selection of the forecasting model should start from the behavior observed in the historical series, evaluating the models most suitable to represent its components and comparing the results obtained.
When demand behavior changes, the model used should be reassessed to follow the new characteristics of the series.
This conclusion reinforces that there is no fixed model for each product, but rather a model that is more suitable for the behavior observed in that context.
Comments and Sharing
Which factor do you consider most relevant for explaining demand behavior: life cycle, market cycle, or business characteristics?
When the historical series changes behavior, what evidence should lead to a review of the forecasting model?