
MAD: understanding mean absolute deviation

MAD: understanding mean absolute deviation
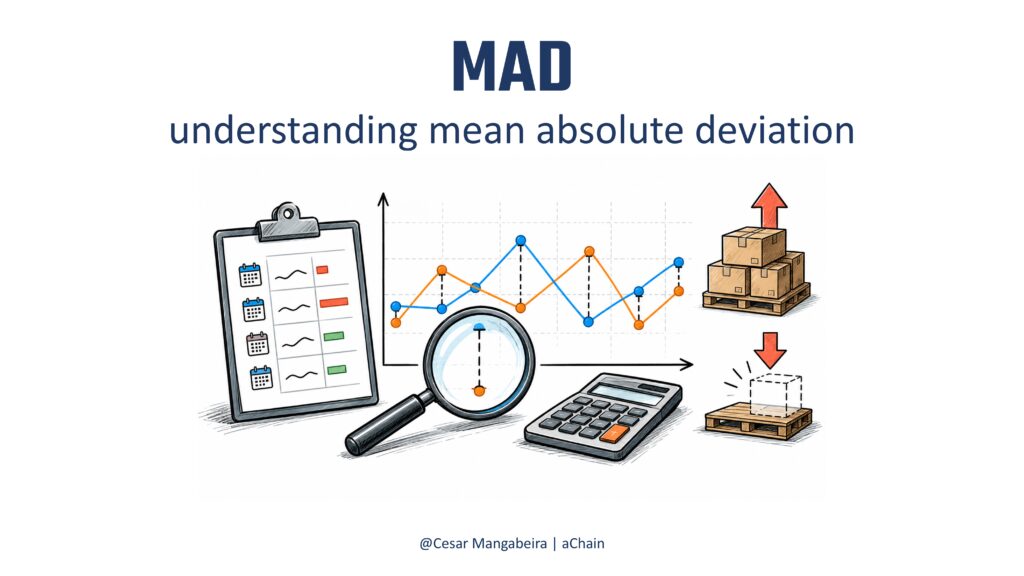
When a demand forecast is compared with actual demand, an important question arises: what was the average size of the errors across the periods analyzed?
Mean Absolute Deviation (MAD) answers this question using the demand unit itself. The indicator transforms individual deviations into a single measure for monitoring forecast behavior.
🤝 Sponsored Post: www.achain.com.br
- What Is Absolute Deviation (AD)?
Imagine a demand forecast of 500 units for a given period. At the end of the period, actual demand was 460 units.
The difference between actual demand and the forecast was:
460 − 500 = −40 units
The value of −40 units represents the forecast error. The negative sign indicates that actual demand was 40 units below the forecast.
To calculate Absolute Deviation (AD), the error sign is removed by applying the absolute value:
AD = |−40| = 40 units
AD therefore represents the distance between the forecast and actual demand, considering the magnitude of the error regardless of its direction.
The absolute value is used because, when analyzing the average size of forecast errors, the relevant question is how far the forecast was from actual demand. Whether the error occurred above or below the actual result can be analyzed separately through bias indicators.
The AD formula is:
AD = |Actual Demand − Forecast|
- Why Use the Absolute Value?
Using the absolute value has a practical reason for supply chain planning.
Overforecasting can generate excess inventory, idle capacity, purchases above actual requirements, or excess production. Underforecasting can lead to product shortages, lost sales, stockouts, and service difficulties.
Both directions of error can generate operational impacts. For this reason, the size of the error needs to be considered regardless of its direction.
Imagine four periods with the following forecast errors:
Period 1: −20 units
Period 2: −30 units
Period 3: +20 units
Period 4: +30 units
If the errors are added directly:
−20 − 30 + 20 + 30 = 0
The result is zero, even though four forecast errors occurred, with magnitudes of 20, 30, 20, and 30 units.
Simply adding the errors can hide the existence and size of the deviations. An error in one direction can numerically offset an error in the opposite direction.
When the absolute value is applied, each error represents its magnitude:
|−20| = 20
|−30| = 30
|+20| = 20
|+30| = 30
The sum of the absolute deviations is:
20 + 30 + 20 + 30 = 100 units
With four periods, MAD is:
MAD = 100 ÷ 4 = 25 units
The result shows that the average absolute forecast error was 25 units per period.
The absolute value allows the magnitude of forecast errors to be measured without errors in opposite directions canceling each other out.
The direction of the error remains relevant for bias analysis. For MAD, the objective is to measure how far the forecast was from actual demand, regardless of whether it was above or below it.
- What Is Mean Absolute Deviation (MAD)?
Mean Absolute Deviation (MAD) represents the average of the Absolute Deviation (AD) values observed across several periods.
AD presents the deviation of an individual forecast. MAD combines these deviations into an average measure for the historical period analyzed.
The formula is:
MAD = ΣAD / n
Where:
- ΣAD = sum of Absolute Deviations
- n = number of periods evaluated
A lower MAD generally indicates a lower average forecast error in demand units.
- Why Is MAD Expressed in Units?
An important characteristic of MAD is its unit of measurement.
If demand is measured in units, cases, tons, or liters, MAD will use the same unit as demand.
A MAD of 5 units means that, considering the set of periods analyzed, the average absolute deviation was 5 units per period.
This information can be directly applied to decisions involving inventory, purchasing, production, and capacity because the result can be interpreted using the same unit used in the operation.
- How to Calculate MAD
Consider the following history:
Period 1: Forecast = 95; Actual Demand = 100; AD = 5
Period 2: Forecast = 210; Actual Demand = 200; AD = 10
Period 3: Forecast = 145; Actual Demand = 150; AD = 5
Period 4: Forecast = 82; Actual Demand = 80; AD = 2
Sum of AD:
5 + 10 + 5 + 2 = 22
Number of periods:
4
MAD:
22 ÷ 4 = 5.5
The result is a MAD of 5.5 units per period.
- How to Interpret the Result
Imagine two models evaluated over the same period.
Model A: MAD = 5.5
Model B: MAD = 12.8
Model A produced a lower average absolute forecast error during the period analyzed.
The comparison allows the identification of which model produced lower average deviations within the same demand context and unit of measurement.
- MAD and MAPE: When to Use Each Indicator
MAD and MAPE analyze forecast errors from different perspectives.
MAD uses units or quantities. It answers an operational question: how many units, on average, was the forecast away from actual demand?
MAPE uses a percentage. It answers a relative question: what was the average error as a percentage of actual demand?
Imagine a MAD of 5 units.
For an item with average demand of 500 units, 5 units represent approximately 1%.
For another item with average demand of 17 units, 5 units represent approximately 29%.
The same MAD can therefore represent very different situations when demand volumes change.
MAD is appropriate when the analysis needs to show the impact of the error in quantity. MAPE can be used when a percentage comparison between items, products, or operations with different volumes is relevant.
The focus of this article remains on MAD. MAPE is included here only to show the difference between analyzing forecast error in units and analyzing it as a percentage.
- What Can Increase MAD?
Several factors can increase MAD over time.
- Inconsistent historical data.
- Sudden changes in demand.
- Promotions not considered in the forecast.
- Product launches or discontinuations without updating the model.
- Inappropriate statistical parameters.
- Forecast horizons incompatible with demand behavior.
- Lack of periodic model review.
- How to Reduce MAD
Reducing MAD depends on investigating the causes of deviations and reviewing the elements that influence forecasts.
- Review statistical models periodically.
- Improve historical data quality.
- Incorporate relevant commercial information.
- Segment products according to demand behavior.
- Monitor trends and seasonality.
- Compare forecasting models over equivalent periods.
- Track MAD over time to identify changes in forecast performance.
🤝 Sponsored Post: www.achain.com.br
- Conclusion
AD measures the absolute deviation of an individual forecast. MAD calculates the average of these deviations across several periods.
Using the absolute value prevents errors in opposite directions from offsetting each other and allows the magnitude of deviations to be measured regardless of their direction.
As a result, MAD allows forecasting models to be evaluated and forecast error to be interpreted directly in the demand unit.
When the analysis requires percentage comparisons across different volumes, MAPE can complement the assessment. Each indicator addresses a specific analytical need.
Comments and Sharing
Which planning decision can be better supported when forecast error is presented in units?
When comparing forecasts for items with very different volumes, do you prefer to analyze the error in units or as a percentage?
Share your opinion in the comments.
#MAD #AbsoluteDeviation #Forecast #Planning